Overview
ClaudeSavvy is a free, open-source local web dashboard for tracking Claude Code usage. It reads Claude Code's session files from your machine and serves a full analytics dashboard at http://localhost:5000 — no cloud, no account, no data leaving your machine.
It covers every angle of your Claude Code activity: token costs by project and conversation, MCP server call volumes, tool usage patterns, sub-agent token exchanges, file edits, context growth, cache costs and savings, and your full Claude Code configuration. The Harness section goes further — it scores how efficiently each session ran, estimates how many dollars were wasted on tool errors and duplicate work, and shows which parts of your harness haven't been used in 30 days. All filterable by time period and model.
~/.claude/ on your machine. No accounts, no telemetry, no data sent anywhere. MIT licensed and open source.
The app's sidebar groups these into Costs & Usage (Dashboard, Conversations, Tokens), Harness (Overview, Sub-Agents, Teams, MCP Servers, Tools & Features, Configuration), Workspace (Projects, Files), and System (Settings).
Installation
Install from PyPI:
pip install claudesavvyRequires Python 3.9 or later. Or install from source:
git clone https://github.com/allannapier/claudesavvy.git
cd claudesavvy
pip install -e .
Verify the install:
claudesavvy --versionQuick Start
Launch the dashboard by running claudesavvy in your terminal. It starts a local web server and opens http://localhost:5000 in your browser automatically.
claudesavvyThe dashboard reads all Claude Code session data from ~/.claude/projects/ immediately. No configuration needed — if you've run Claude Code before, your data is already there.
Dashboard — Overview Metrics
The Dashboard is your home screen. It shows four headline metrics at the top:
Total Cost and Cache Write Cost show a period-over-period delta — the % change vs the equivalent previous period, coloured red when costs are up. Cache Write Cost also shows its share of total spend, since re-caching context is usually the largest controllable cost line. Cache Savings is the net dollar amount saved by cache reads, after subtracting the cache-write premium (writes cost 1.25× regular input). Top Conversation Cost links straight to that conversation's detail view.
Below the cards, a wasted-spend callout estimates how much of the period's spend looks like waste ("~$X of this period's spend looks like waste") and links to the Harness page for the breakdown.
A Recent Conversations feed shows your latest sessions with turn counts, costs, and a context-utilisation bar — each row links to the conversation detail. A Model Usage breakdown shows which models you've used, their share of cost, token counts, and spend. Finally, an Explore Your Usage grid links to every other page with a live summary (e.g. "7 MCP servers, 803 total calls").
Charts
The Dashboard includes two rows of charts, all driven by the selected time period:
Cost Over Time
A line chart of your daily spend within the selected time period. Cost trends use accurate per-model pricing, so a heavy Opus day stands out from a heavy Haiku day.
Cost Breakdown
A donut/pie chart showing cost distribution across projects or models.
Project Costs Over Time
A stacked area chart showing how each project's cost contributes to total spend over the selected period.
Top Projects by Cost
A table of your most expensive projects in the period, linking through to the Projects page.
Export
The Dashboard has an Export button in the top-right that lets you download your usage data as CSV or JSON. Use this to back up your analytics, import into a spreadsheet, or share with your team.
Token Usage
The Tokens page gives a detailed breakdown of every token type consumed. Filter by Model and Time Period independently — useful for comparing token patterns across claude-opus vs claude-sonnet, for example.
Metrics shown
- Input Tokens — new (non-cached) input tokens sent to the model
- Output Tokens — tokens generated by the model in responses
- Total Input* — combined input including cache reads (marked with asterisk)
- Cache Reads — tokens served from the prompt cache (at reduced cost)
Understanding the split between fresh input and cache reads helps you evaluate how well your prompts are taking advantage of Claude's prompt caching. A high cache read share means lower costs per turn.
Projects
The Projects page shows per-project usage analytics. Each project corresponds to a working directory where you've run Claude Code. Filter by Model and Time Period.
Metrics shown
- Total Projects — number of distinct projects in the selected period
- Avg Commands/Project — average number of Claude Code commands per project
- Most Active Project — the project with the most activity
All Projects table
The table lists every project with its total cost, session count, and other stats — with client-side search, column sorting, and pagination. Click any project to drill into its conversations. Costs are calculated using Anthropic's official per-token pricing for each model; dated model IDs, Bedrock/Vertex prefixes, and the [1m] long-context marker are all resolved correctly, and unrecognised IDs fall back to the closest rate within the same model family.
Conversations
The Conversations page is one of ClaudeSavvy's most powerful views. It shows every Claude Code conversation with rich analytics — sorted by cost by default.
Summary metrics
Avg Prompts / Conv. counts real human prompts — messages you typed — rather than every agentic turn, so it reflects how much you actually asked for per conversation. Most Expensive shows the project and date so you know which session it was.
Conversations table columns
| Column | Description |
|---|---|
| Project | Project name and model used for this conversation |
| Started | Date and time the conversation began |
| Duration | Total elapsed time from first to last turn |
| Turns | Number of message exchanges in the conversation |
| Total Tokens | Combined token count across all turns |
| Peak Context | Largest context window used, with a visual fill bar — the limit is model-aware (1M tokens for [1m] model variants, 200K otherwise) |
| Cache % | Percentage of input tokens served from cache for this conversation |
| Cost | Total cost for the conversation |
Context growth chart
Click any row in the conversation table to open a context growth chart for that conversation — a line chart showing how the context window grew turn by turn, with the model's context limit drawn as a reference line. This is invaluable for understanding which conversations ballooned in context (and cost) and why.
Deep links
Conversations support direct links: /conversations?session=<id> opens that conversation's detail automatically. The Dashboard's Top Conversation card and Recent Conversations rows use these links, so you can jump from a headline number straight to the session behind it.
Files
The Files page shows file-level activity statistics — which files Claude Code has read, written, or modified, and how many times.
Summary metrics
- Total Files — number of unique files touched in the period
- Most Edited File — the file with the most operations
- Total Operations — sum of all file reads, writes, and edits
- Projects with Files — how many projects have file activity data
The Recent File Operations table lists each file with its project, operation count, and total activity. Useful for auditing which files Claude Code has touched most during a session or period.
Integrations — MCP Servers
The MCP Servers page (under the Harness group in the app) tracks your MCP (Model Context Protocol) server usage — showing which external tools and servers Claude Code called, how many times, and at what token cost.
Summary metrics
- MCP Servers — number of distinct MCP servers called in the period
- Total Calls — sum of all MCP tool invocations
- Total Tokens — tokens attributed to MCP tool calls
- Total Cost — estimated cost of MCP-related token usage
The detail table breaks these down per server — for example, showing that chrome-devtools was called 803 times in a period. This helps identify which integrations are consuming the most context.
Features & Tools
The Features page tracks which Claude Code tools (Bash, Read, Write, Glob, Agent, Skill, etc.) were called, how many times, and what they cost. Two views are available via tabs.
Tools Overview tab
Summary metrics: Total Tools Used, Total Calls, Total Tokens, Total Cost, Sub-Agents Used.
The Tool Usage table lists every tool with: call count, tokens consumed, cost per call, usage trend, and turn cost share. Click any row to see a detailed token breakdown by conversation for that tool.
| Column | Description |
|---|---|
| Tool Name | The Claude Code tool (Bash, Read, Write, Glob, Edit, Agent, Skill, etc.) |
| Category | Tool type (always "tool" in current version) |
| Calls | Number of times this tool was invoked |
| Tokens | Total tokens attributed to calls of this tool |
| Cost/Call | Estimated average token cost per invocation |
| Trend | Whether usage of this tool is rising or falling |
| Turn Cost Share | This tool's share of the cost of the turns it appeared in |
Unified Timeline tab
Switches to a chronological view of all tool calls across all sessions — showing exactly when each tool was called and in which conversation. Useful for reconstructing what happened in a session or identifying patterns in tool usage over time.
Sub-Agents
The Sub-Agents page tracks token exchanges from Task tool sub-agent invocations — when Claude Code launches a sub-agent (another Claude instance) to handle a delegated task.
Metrics shown
- Total Exchanges — number of sub-agent invocations recorded
- Total Tokens — tokens consumed across all sub-agent exchanges
- Total Cost — cost attributed to sub-agent usage
- Avg Tokens/Exchange — average token load per sub-agent invocation
Sub-agent token tracking helps you understand the overhead of agentic workflows — particularly useful if you're building pipelines where Claude Code delegates to specialised sub-agents.
Teams
The Teams page tracks token usage for the Claude Code Teams feature — when Claude Code runs as a shared tool across a team, with usage aggregated per member.
Metrics shown
- Total Team Runs — number of team-mode sessions recorded
- Total Tokens — combined token usage across all team runs
- Total Cost — total cost attributed to team usage
Harness Overview
Your agent harness is everything wired into Claude in your workspace — skills, sub-agents, MCP servers, plugins, hooks, and commands. The Harness Overview page answers two questions about it: how well is it working (session quality scoring and wasted-spend estimates) and what's actually in it (a full inventory annotated with real 30-day usage).
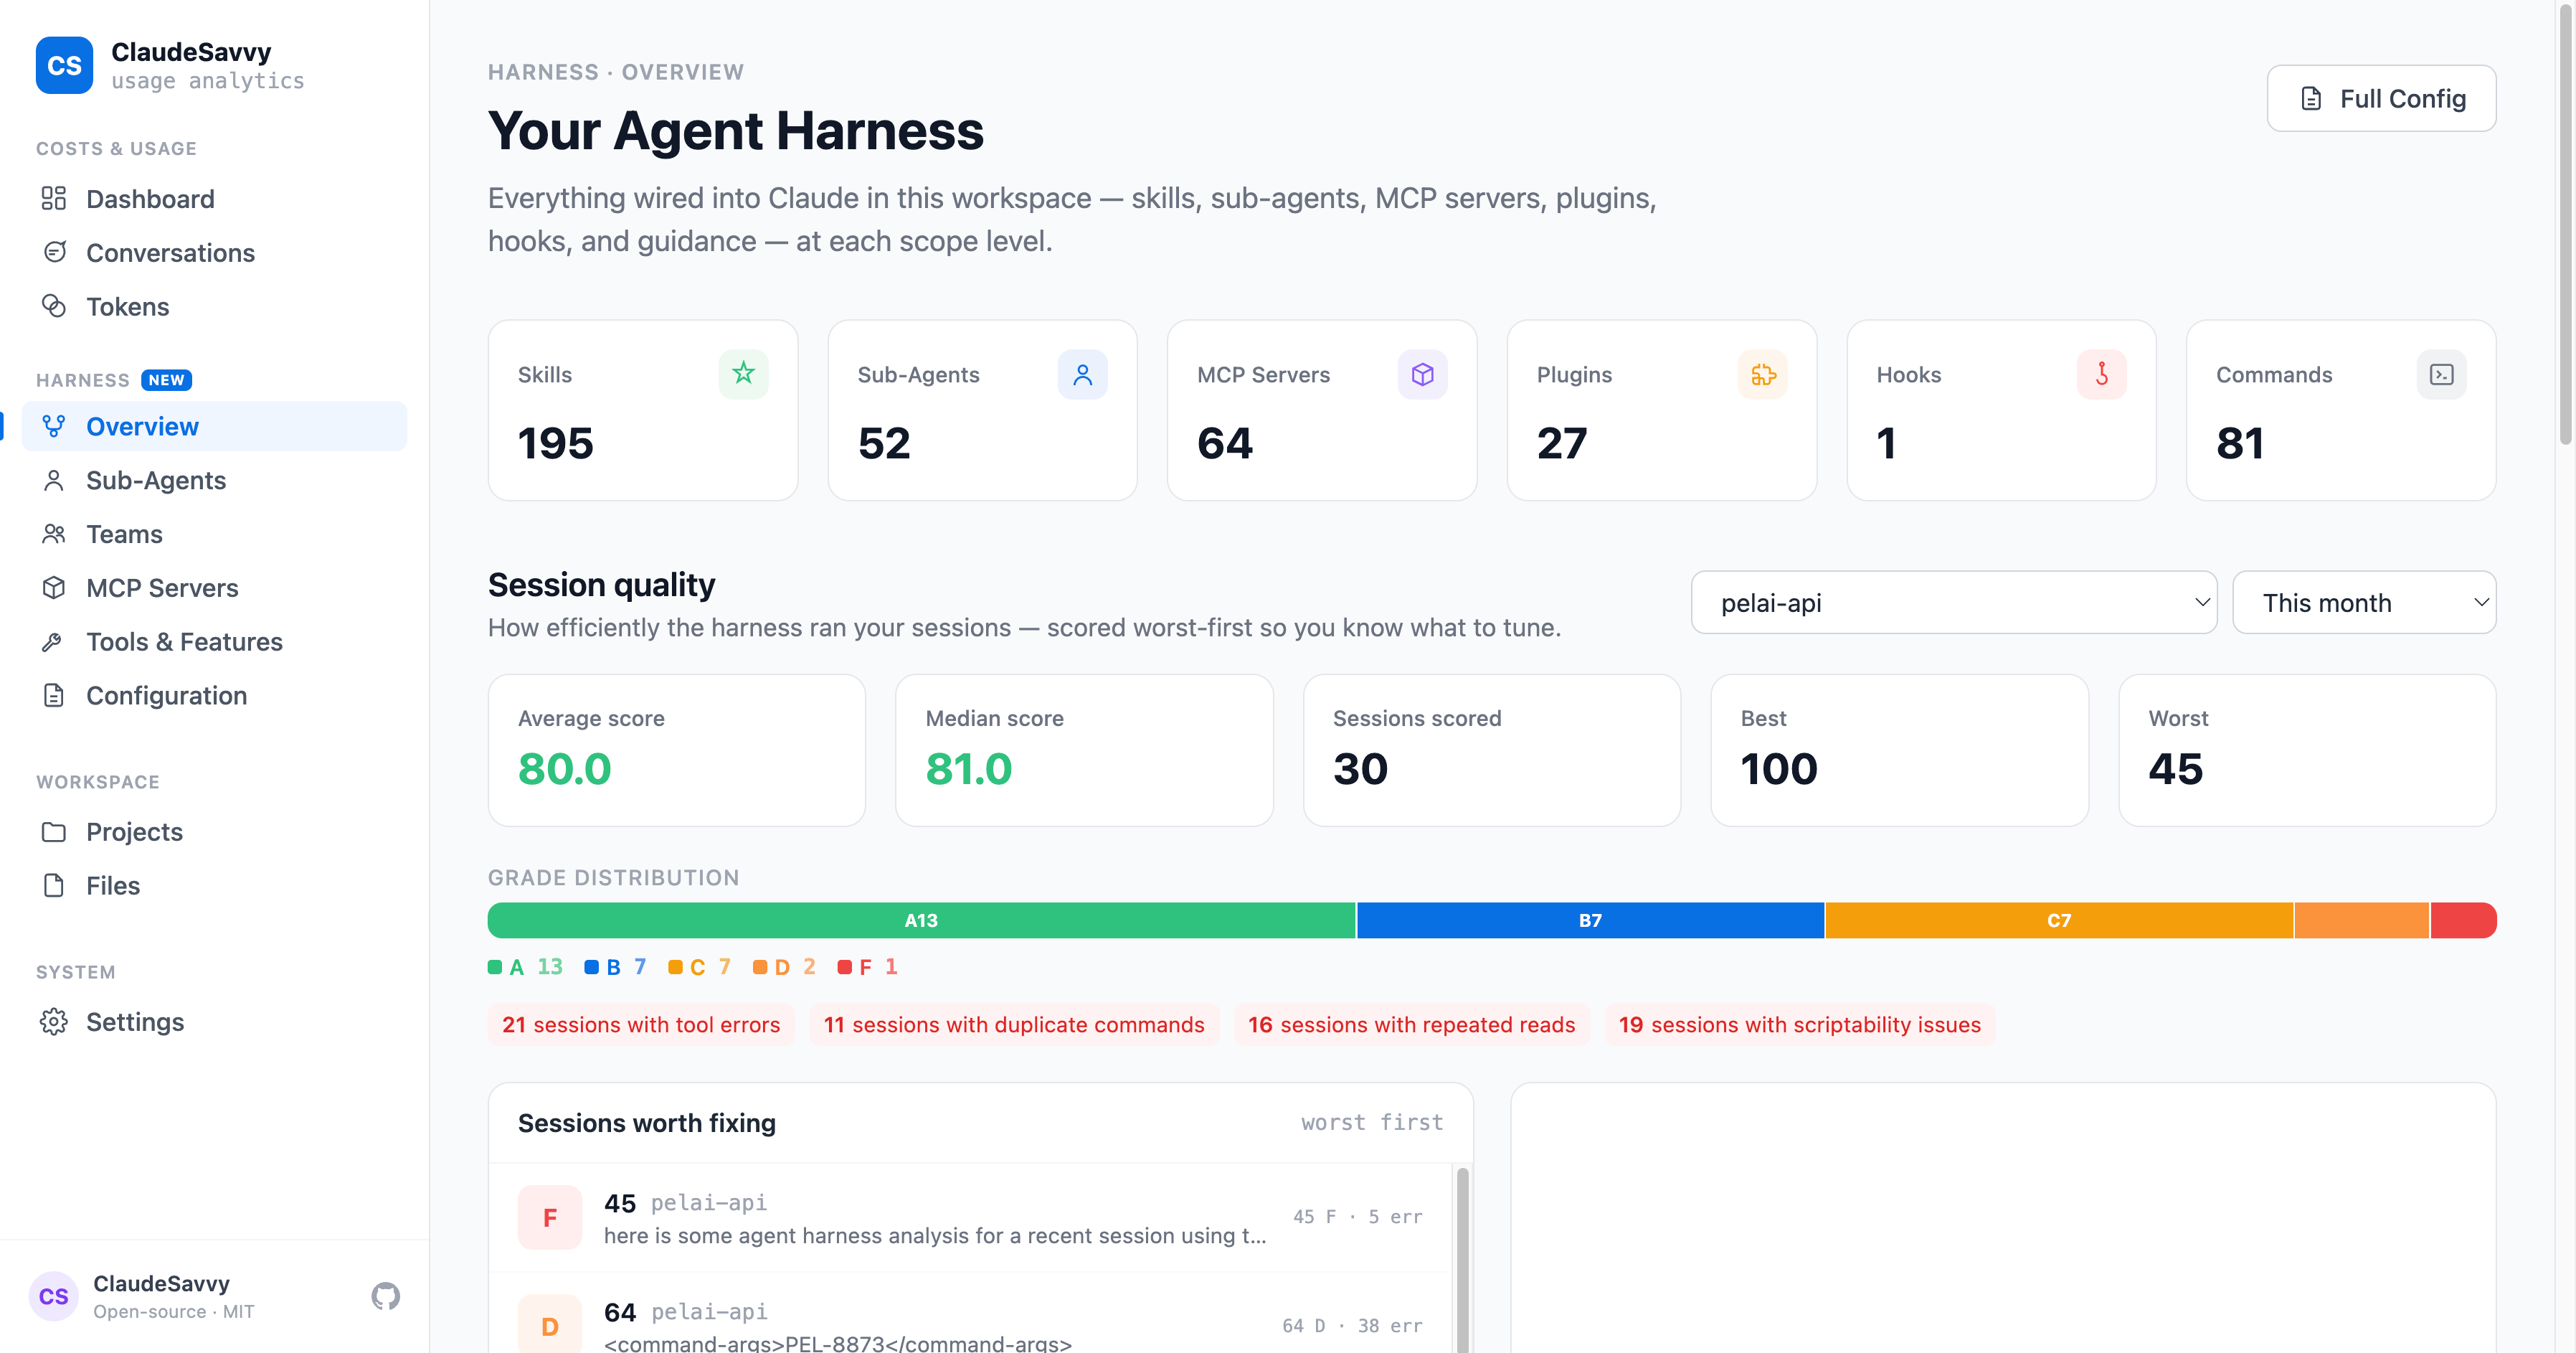
The page leads with Session quality — the most actionable view — followed by the harness inventory KPI row and scope-level breakdown. It has its own time period filter (defaulting to Last 7 days, independent of the shared period used by the analytics pages) plus a project filter, so you can score just one repo's sessions.
In the app's sidebar, the Harness group also collects the related pages: Sub-Agents, Teams, MCP Servers, Tools & Features, and Configuration — and the Overview page links to each at the bottom.
Session Quality
ClaudeSavvy scores every Claude Code session from 0–100 (with an A–F grade) based on how efficiently the harness ran. The score combines five weighted categories:
- Tool errors — tool calls that returned errors (errors / tool calls)
- User rejections — calls you declined at the permission prompt (rejections / tool calls)
- Duplicate commands — the same shell command run repeatedly (extra duplicates / bash calls)
- Repeated reads — the same file read over and over (extra re-reads / read calls)
- Scriptability — binaries hammered so often a script or skill would do better (over-hammered binaries / unique binaries)
Aggregate strip
The grade distribution bar gives a visual breakdown across A–F tiers, and issue chips show how many sessions exhibited each problem (e.g. "3 sessions with tool errors") so you can spot patterns. Low-activity sessions (fewer than 3 tool calls) are flagged and excluded from the aggregates so they don't inflate your average.
Sessions worth fixing
The leaderboard ranks sessions by dollars wasted (score as tie-break) — a mediocre $40 session matters more than a terrible $0.20 one. When the page loads, the worst session's detail is opened automatically, so you land directly on the most expensive problem.
Session detail panel
Clicking any session shows the full breakdown:
- Score, grade, session cost, and estimated waste for that session
- Activity metrics — turns, tool calls, bash calls, errors, rejections, sub-agents
- Category score bars with each category's weight and the underlying rate (e.g. "4/120 errors / tool calls")
- Tuning suggestions — concrete recommendations for what to change
- Offender detail — the specific tool errors and rejected calls, with snippets
Wasted Spend
ClaudeSavvy converts harness quality issues into dollars. Wasteful calls — errored tool calls, extra duplicate commands, and extra re-reads — are priced at each session's average cost per tool call, giving an estimated wasted spend figure.
- The Harness page's aggregate strip shows total wasted spend and what % of scored session cost it represents
- Each leaderboard row carries a red per-session waste badge (e.g. −$1.34)
- The session detail shows session cost alongside its estimated waste
- The Dashboard shows a callout banner — "~$X of this period's spend looks like waste" — linking straight to the Harness page
This is the fastest way to prioritise harness tuning: instead of chasing every imperfect session, fix the ones that are actually costing you money.
Inventory & 30-Day Usage
Below the quality section, a KPI row counts every harness component: Skills, Sub-Agents, MCP Servers, Plugins, Hooks, and Commands. Skills, sub-agents, and MCP servers are annotated with real usage — "X of Y used in 30d" — based on a scan of the last 30 days of tool invocations.
Each inventory item gets a badge: a green N× 30d count if it was invoked, or a grey no use 30d marker if it wasn't. Dead harness weight — skills you wrote and forgot, MCP servers eating context for nothing — is finally visible at a glance.
Scope levels
The inventory is organised into three tabs matching Claude Code's configuration scopes:
| Scope | Source |
|---|---|
| User Level | Your global ~/.claude/ configuration — applies everywhere |
| Project Level | Each repo's .claude/ directory, grouped per repository |
| Plugin Level | External plugins discovered from your settings, with their scope badge |
Every scope card links through to the Configuration page for the full detail, and the bottom of the page has quick links into Sub-Agents, MCP Servers, Tools & Features, and Configuration.
Configuration Viewer
The Configuration page is a read-only browser for your Claude Code configuration — showing every skill, MCP server, slash command, plugin, hook, and agent defined across your user config and all your projects.
Repository selector
Use the Repository dropdown to switch between your user-level configuration (User Configuration) and any of your project directories. Each project's CLAUDE.md and settings files are parsed and displayed.
What's shown
- Skills — custom skills defined in your Claude Code config
- MCPs — MCP servers configured for this context
- Commands — slash commands defined (e.g.
/commit,/review-pr) - Plugins — Claude Code plugins installed
- Hooks — event hooks configured (pre/post tool use, session start, etc.)
- Agents — custom agent definitions
Click any category tab (Skills, MCPs, Commands, Plugins, Hooks, Agents) to see the full list with descriptions. Use the Export button to download the configuration as JSON. The Refresh button re-reads config files from disk.
Status Line
ClaudeSavvy can install a live status line directly into Claude Code's terminal interface — showing your today's cost, token count, cache hit rate, session count, and monthly spend, updated in real-time as you work.
One-click install
Go to Settings in ClaudeSavvy and click One-click install. ClaudeSavvy will:
- Install the status line script into your Claude Code setup
- Configure
settings.jsonto run the script automatically - Show a live preview of what the status line will look like
Once installed, the status line appears at the bottom of every Claude Code session. You'll see a confirmation that Script installed and settings.json configured.
To remove the status line, go to Settings and uninstall — ClaudeSavvy will clean up the script and revert settings.json.
Model Pricing Configuration
ClaudeSavvy ships with a built-in pricing table synced to official Claude API rates — including Claude Fable 5, the Opus 4.x family, Sonnet, and Haiku. Settings → Model Pricing Configuration lists every built-in model up front, with models found in your session data badged In use, so applicable rates are visible before a model is ever used.
Sync prices from anthropic.com
Click Sync prices from anthropic.com to fetch the published pricing page and store current rates locally. Synced prices become the new defaults — so a price change at Anthropic doesn't require a ClaudeSavvy update. Custom per-model overrides always take precedence over synced and built-in rates.
Custom overrides
For each model you can set custom rates (e.g. for a private deployment or negotiated enterprise pricing):
- Input (per million tokens) — cost per 1M input tokens
- Output (per million tokens) — cost per 1M output tokens
- Cache Write (per million tokens) — cost per 1M cache write tokens
Changes are applied immediately to all cost calculations across every page, and overridden models are highlighted with a one-click reset back to defaults.
claude-opus-4-8-20260115), Bedrock/Vertex prefixes (us.anthropic.*), and the [1m] long-context marker all resolve to the right rate. Genuinely unknown IDs fall back to the closest rate within the same model family, so future model releases are costed sensibly out of the box.
Time Filters
Every page in ClaudeSavvy has a time period selector. Available options:
| Option | What it shows |
|---|---|
| Last 15 min | The past 15 minutes only — great for checking the cost of your last command (available on Conversations, Tools & Features, Files, and Sub-Agents) |
| Today | From midnight to now (default on most pages) |
| This week | From the start of the current week (Monday) |
| Last 7 days | Rolling 7-day window ending now |
| This month | From the 1st of the current month |
| Last 3 months | Rolling 90-day window |
| All time | All session data ClaudeSavvy has read (default on Teams page) |
| Custom range… | Pick a specific start and end date |
Shared across pages
All main analytics pages — Dashboard, Conversations, Tokens, Projects, Tools & Features, Files, MCP Servers, Sub-Agents — share a single selected period. Pick "Last 7 days" on one page and every other page follows; no more re-selecting the same range eight times. Two pages keep their own independent period because their data has different semantics: Harness (defaults to Last 7 days) and Teams (defaults to All time).
The Tokens page also has an independent Model filter, letting you isolate usage for a specific model (e.g. claude-opus-4-8 only) within any time period.
FAQ
Does it send my data anywhere?
No. ClaudeSavvy is a local web server — it reads from ~/.claude/ and serves the dashboard at localhost:5000. No analytics, no telemetry, no external requests. MIT licensed.
Why don't I see any data?
You need at least one completed Claude Code session. Run a Claude Code session first, then launch ClaudeSavvy. If sessions exist but data doesn't appear, check that ~/.claude/projects/ contains .jsonl session files.
What Claude Code versions are supported?
ClaudeSavvy works with Claude Code CLI 1.x and later. If you're on an older version, upgrade with npm update -g @anthropic-ai/claude-code.
Can I filter by project across all pages?
The Harness page has a dedicated project filter for session quality scoring, and some pages filter automatically when you navigate from the Dashboard or Projects view. Global project filtering across all pages is on the roadmap.
How is the session quality score calculated?
Entirely locally — ClaudeSavvy analyses each session transcript for tool errors, user rejections, duplicate commands, repeated file reads, and scriptability issues, then combines them into a weighted 0–100 score. Nothing is sent to any model or service; it's deterministic analysis of the JSONL files on your machine. Wasted-spend estimates price those wasteful calls at the session's average cost per tool call.
Does it work with Claude Code Teams?
Yes — the Teams page aggregates team-mode session data. Individual usage always shows in the standard analytics pages regardless of account type.
Can I export my data?
Yes — use the Export button on the Dashboard to download CSV or JSON. The Configuration page also has an Export option for your Claude Code config.
How do I update ClaudeSavvy?
pip install --upgrade claudesavvyCheck the GitHub releases page for changelog details. After updating, restart the server for new features and pricing updates to take effect.